Workload Management
Workload Management



SUMMARY
SUMMARY
SUMMARY
A New Tool to Support Managers In Making Decisions
A New Tool to Support Managers In Making Decisions
A New Tool to Support Managers In Making Decisions
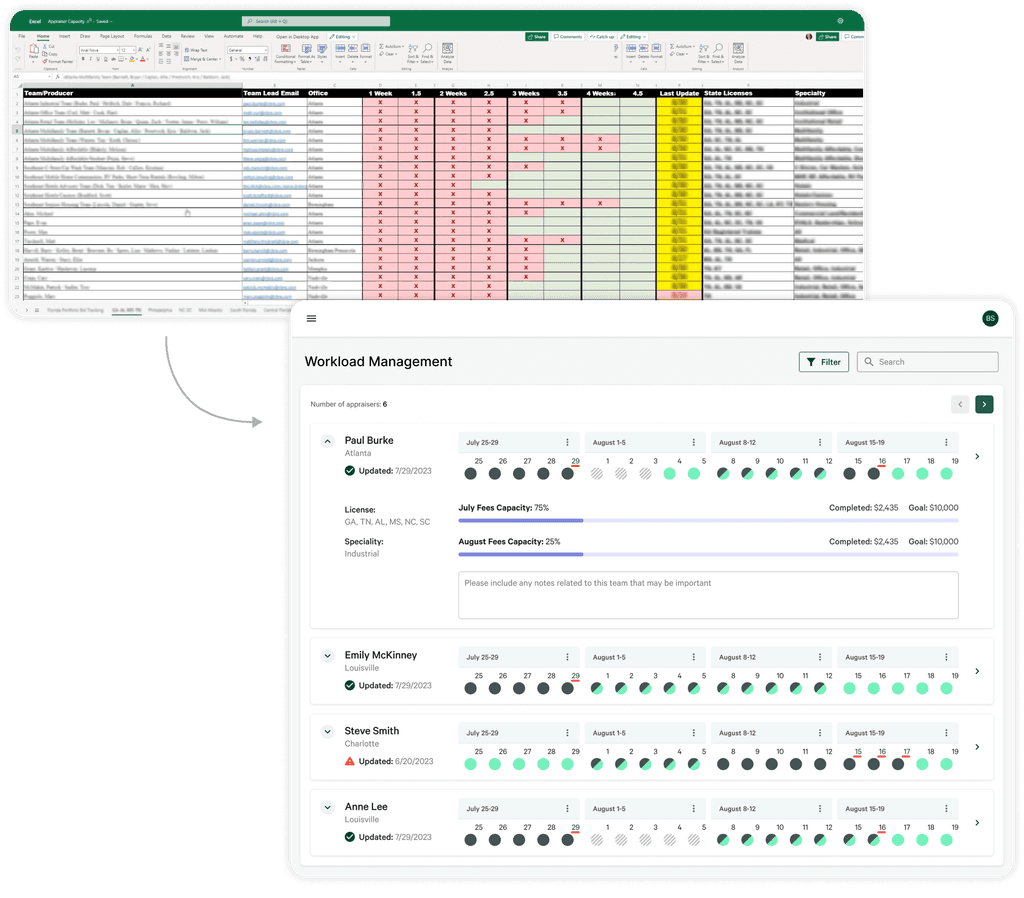
This tool is to improve the experience for both managers and their teams. It provides managers with a clear view of team members' workloads, making it easier to assign work or bid on jobs and it easier for team members to update their workload. This is a project I did for my internship.
My Role
UX Design Intern
My Role
UX Design Intern
My Role
UX Design Intern
Team
2 designers, 1 researcher, 1 project manager
Team
2 designers, 1 researcher, 1 project manager
Team
2 designers, 1 researcher, 1 project manager
Duration
3 months Jul 2022 - Sep 2022
Duration
3 months Jul 2022 - Sep 2022
Duration
3 months Jul 2022 - Sep 2022

Overview:
Designing a new tool to support managers in making decisions
Overview:
Designing a new tool to support managers in making decisions
Designing a new tool to support managers in making decisions
01. USERS
01. USERS
01. USERS
What do users want?
What do users want?
What do users want?
TARGET
USERS
TARGET
USERS
Target Users
Managers & team members (appraisers)
Managers & team members (appraisers)
USER RESEARCH
User Research
Currently, managers and team members are using their own Excel sheets to manage workloads. Team members need to update their workload and managers use the workload data to make staffing decisions.
Our research team interviewed 12 managers and 5 team members. From our user research, we learned that: 100% of our users are not happy with the current system using Excel because they have to manually maintain it and the way the information is displayed on Excel decreases their efficiency. 100% of them wanted the editing workload to take minimal effort and they were in need of other features like viewing due dates or team goals.

Managers :
I need a tool to understand my team members' goals and workload so that I can schedule tasks effectively and support their objectives.
Managers :
I need a tool to understand my team members' goals and workload so that I can schedule tasks effectively and support their objectives.
How might we empower managers to make better staffing decisions?
How might we empower managers to make better staffing decisions?


Team members (Appraisers) :
I need an effortless tool to update my workload so I can save time on appraisals and increase my commission.
Team members (Appraisers) :
I need an effortless tool to update my workload so I can save time on appraisals and increase my commission.
How might we simplify workload updates for appraisers and saves them time?
How might we simplify workload updates for appraisers and saves them time?

Current tool:
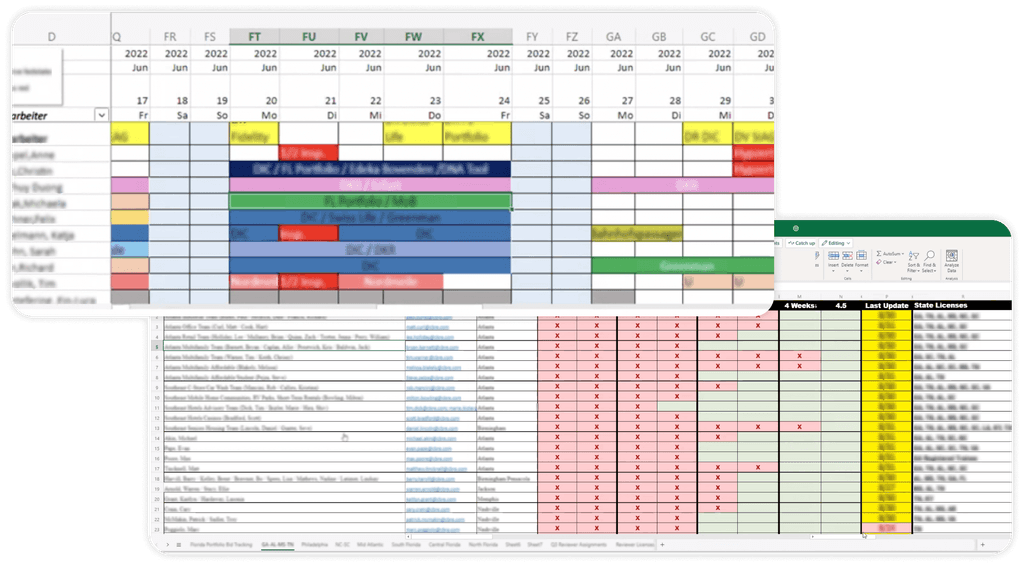
Managers are using their own excel sheets for workload management.
Current tool:
Managers are using their own excel sheets for workload management.
02. GOAL
02. GOAL
02. GOAL
A need for a centralized tool to track workload
A need for a centralized tool to track workload
BUSINESS NEED
BUSINESS NEED
Business Needs
CBRE is an American commercial real estate service and investment company. From a business perspective, the use of Excel sheets does not allow the CBRE to track or sync data with the internal system because each sheet is managed independently. Therefore, there is a need for an internal workload management tool that can be shared across the entire organization to ensure accurate and streamlined management of data.
CBRE is an American commercial real estate service and investment company. From a business perspective, the use of Excel sheets does not allow the CBRE to track or sync data with the internal system because each sheet is managed independently. Therefore, there is a need for an internal workload management tool that can be shared across the entire organization to ensure accurate and streamlined management of data.
USERS' NEEDS
USERS' NEEDS
Users' Needs
Managers need a tool to understand their team's goals and workload.
Team members (Appraisers) require an effortless tool for updating their workload and saving time.
Managers need a tool to understand their team's goals and workload.
Team members (Appraisers) require an effortless tool for updating their workload and saving time.
Managers need a tool to understand their team's goals and workload.
Team members (Appraisers) require an effortless tool for updating their workload and saving time.
DESIGN VARIATIONS
DESIGN VARIATIONS
Design Variations
Together with another designer, we created several design concepts that help managers to understand appraisers' workloads and to help appraisers update their workloads.
Here are the two concepts I created:
Calendar view
Gantt chart view
Together with another designer, we created several design concepts that help managers to understand appraisers' workloads and to help appraisers update their workloads.
Here are the two concepts I created:
Calendar view
Gantt chart view
03. DESIGN
03. DESIGN
03. DESIGN
Concept 1: Calendar View
Concept 1: Calendar View
DESIGN RATIONALE
DESIGN RATIONALE
Design Rationale
Calendar View:
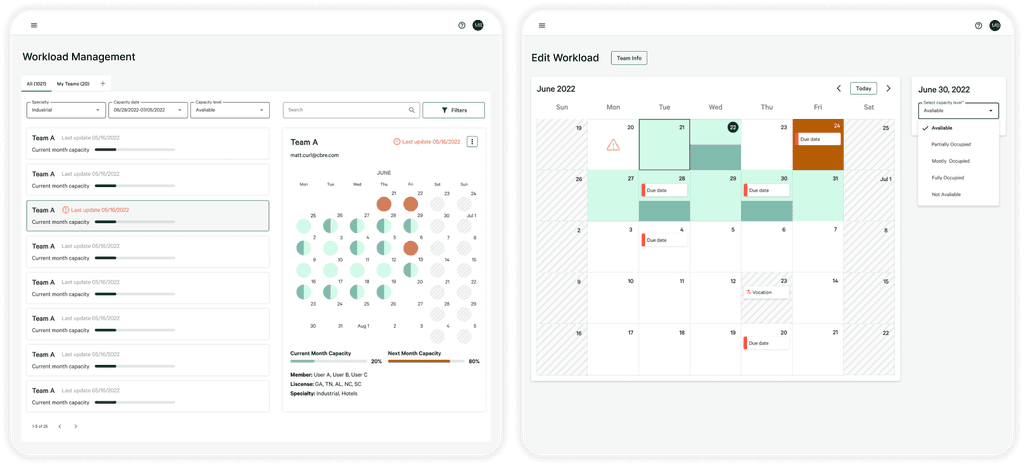
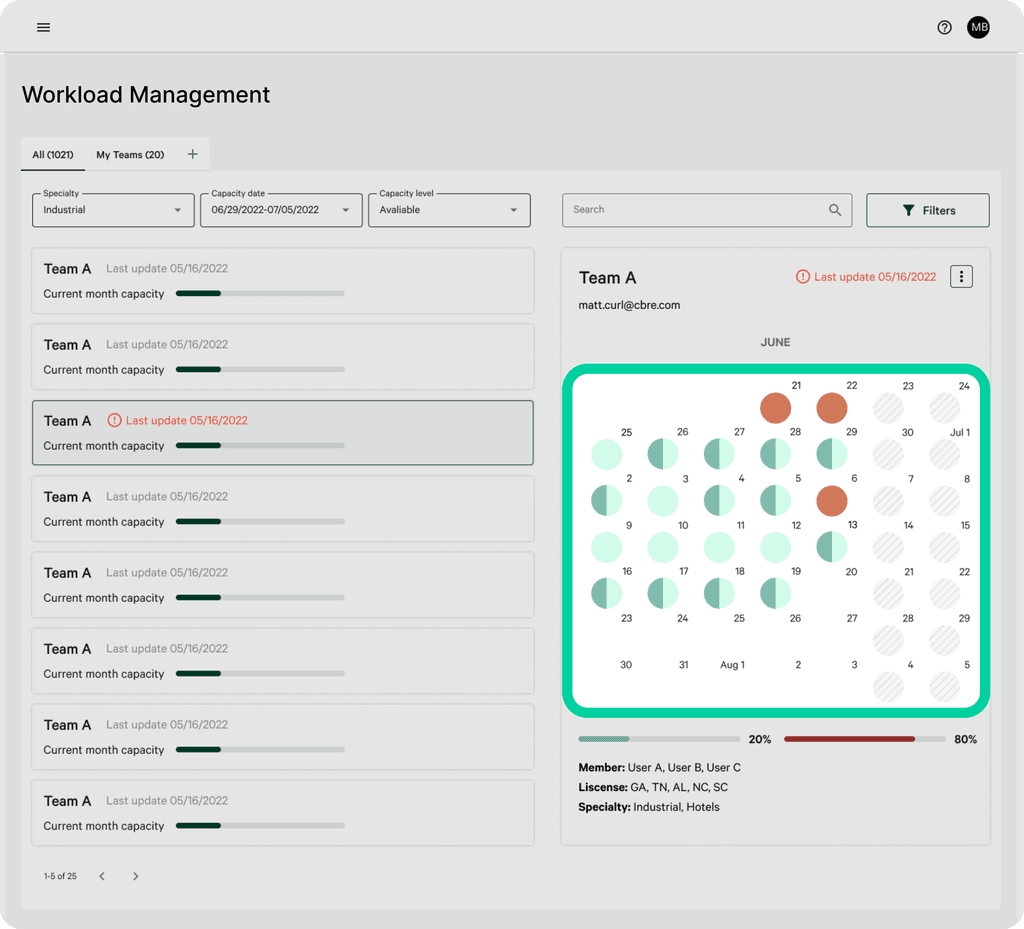
To enhance scheduling efficiency, I created a calendar view resembling Outlook for managers and appraisers who frequently use the platform. By clicking on a team, the workload calendar appears on the right side of the screen, enabling users to retain their selected filters and effortlessly switch between teams without closing windows.
Filters:
By pulling out commonly used filters like specialty, date, and workload level, managers can quickly find a suitable team and decide if they want to bid on more jobs for that team.
Tabs:
Managers can customize tabs to quickly find the teams they focus on, instead of searching for them amongst all teams across CBRE.
Separated Views:
In the old Excel sheet, appraisers and managers had a shared view. This made it difficult for appraisers to find their information among all other appraisers'. I separated the manager and appraiser views to simplify the process for appraisers to update their workload. The new design has each appraiser seeing only their team's calendar, making it easy for them to update their workload using a dropdown menu.
WORKLOAD LEVEL
Workload Levels
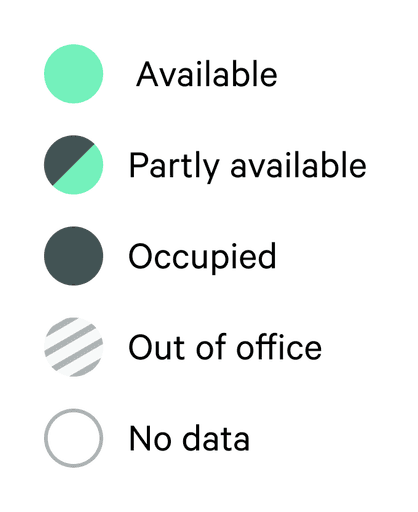
The workload level is represented by intuitive colors and shapes, making it accessible to users with color blindness.
The workload level is represented by intuitive colors and shapes, making it accessible to users with color blindness.


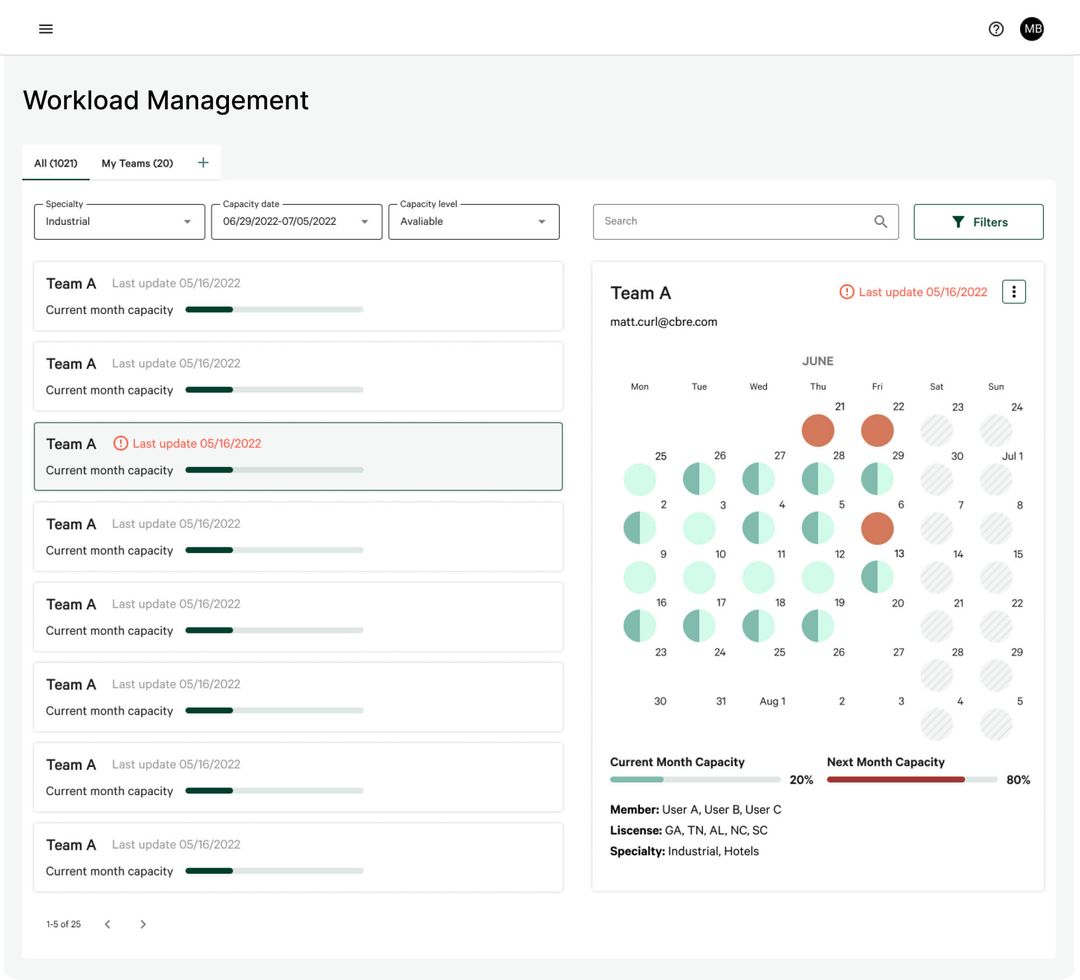


Concept #1: Manager View
Concept #1: Manager View
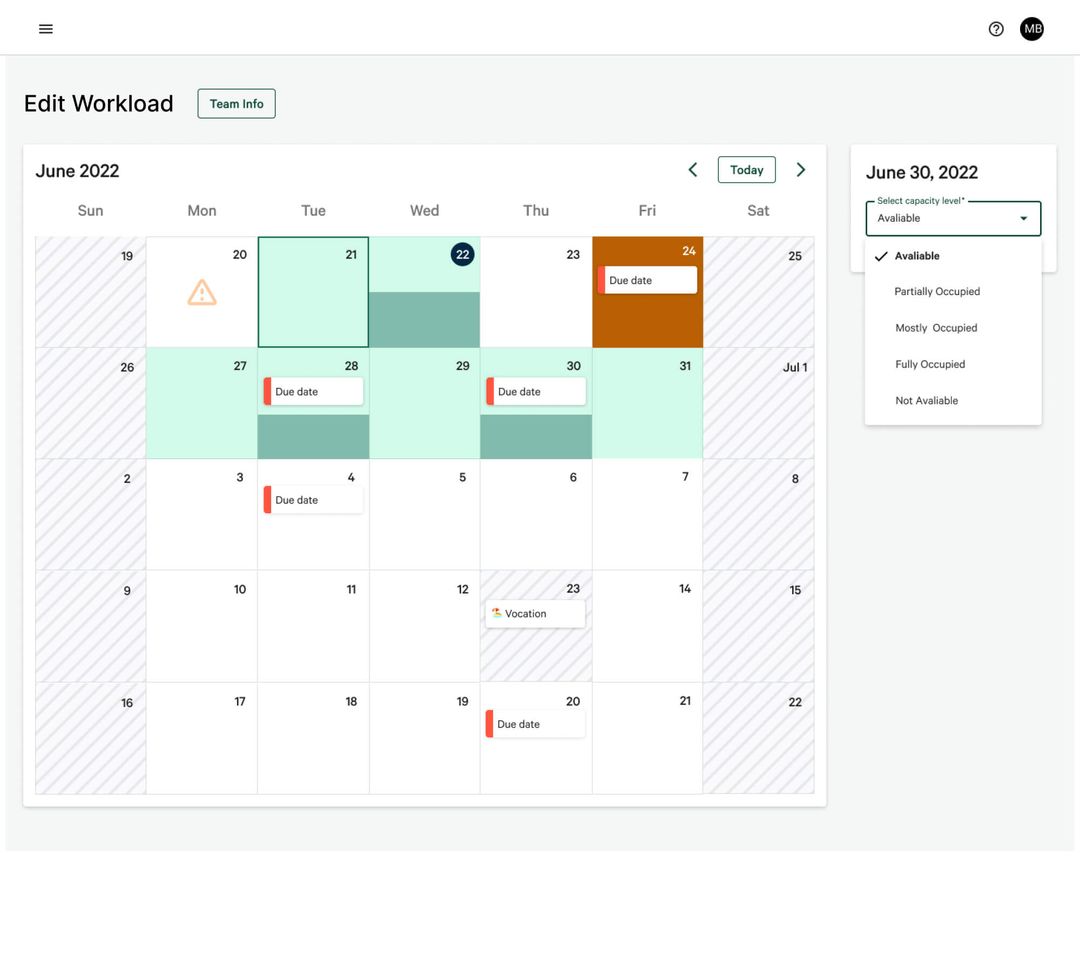


Concept #1: Appraiser View
Concept #1: Appraiser View
03. DESIGN
03. DESIGN
03. DESIGN
Concept 2: Gantt Chart View
Concept 2: Gantt Chart View
DESIGN RATIONALE
DESIGN RATIONALE
Design Rationale
Gantt Chart View:
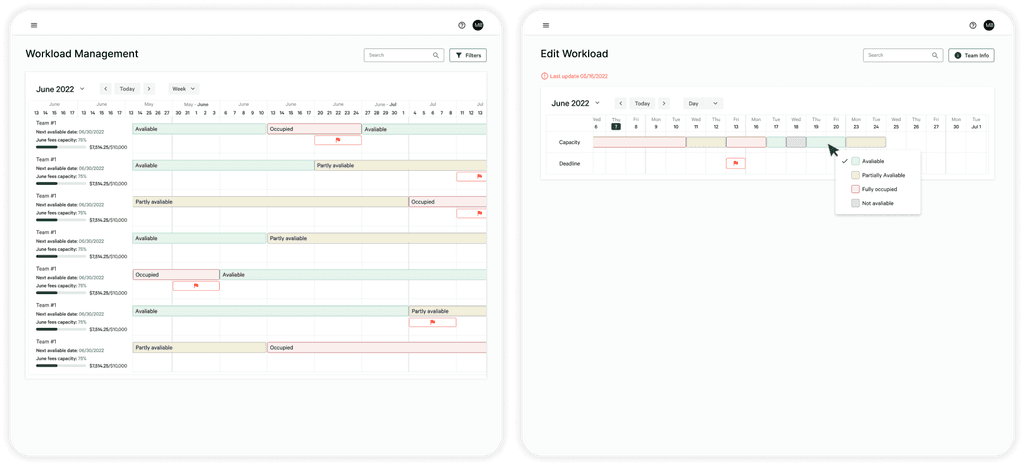
This concept utilizes a layout similar to the Excel sheet currently used by users to minimize users' learning curves. Managers can easily compare teams' workloads without more clicks. Deadlines are marked by red flags to provide users with more workload information.
Switchable time view:
From user research, we know that managers have different preferences for viewing workloads. By clicking on the dropdown, users can switch between day, week, and month views based on their needs.
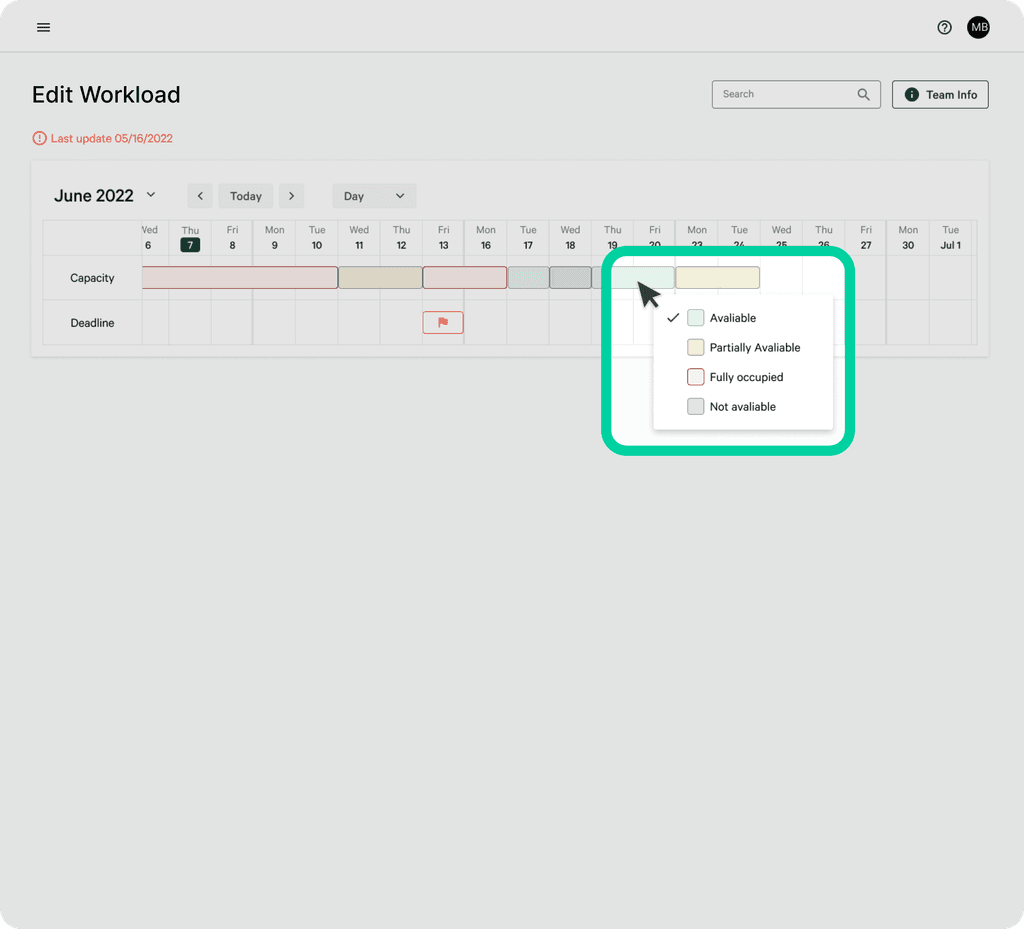
Drag and select to edit the workload:
100% of participants in user interviews wanted editing workloads to be effortless. In this design, users can easily edit their workload by dragging and selecting their timeline. It is a quick and efficient way to make changes, requiring only two steps to complete the editing process.
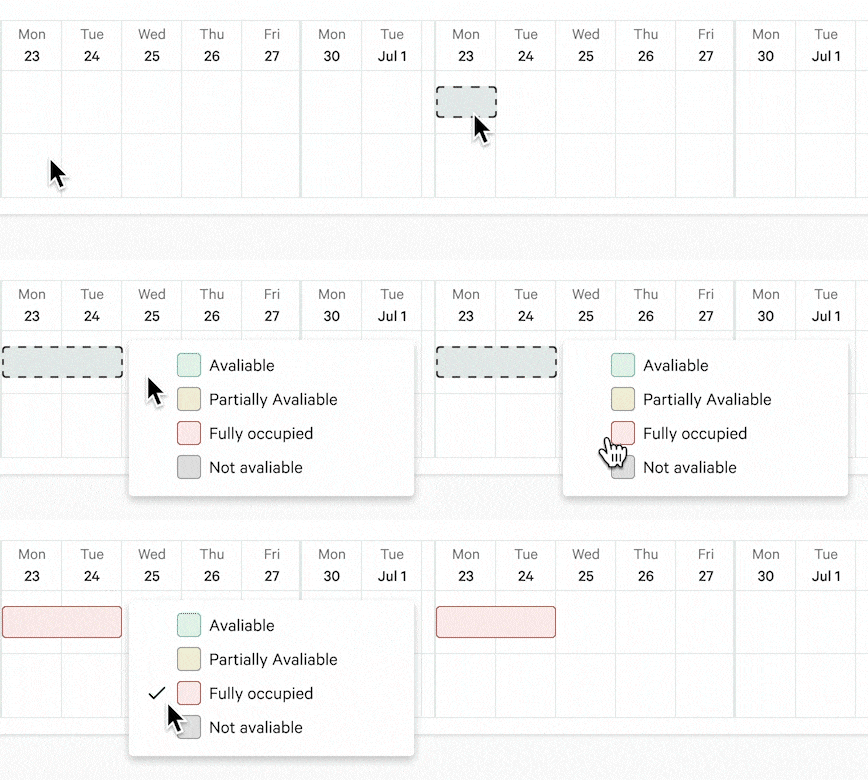
WORKLOAD LEVEL
Workload Levels
The workload levels are represented by bars colored according to the CBRE design system and labeled with text.
The workload levels are represented by bars colored according to the CBRE design system and labeled with text.


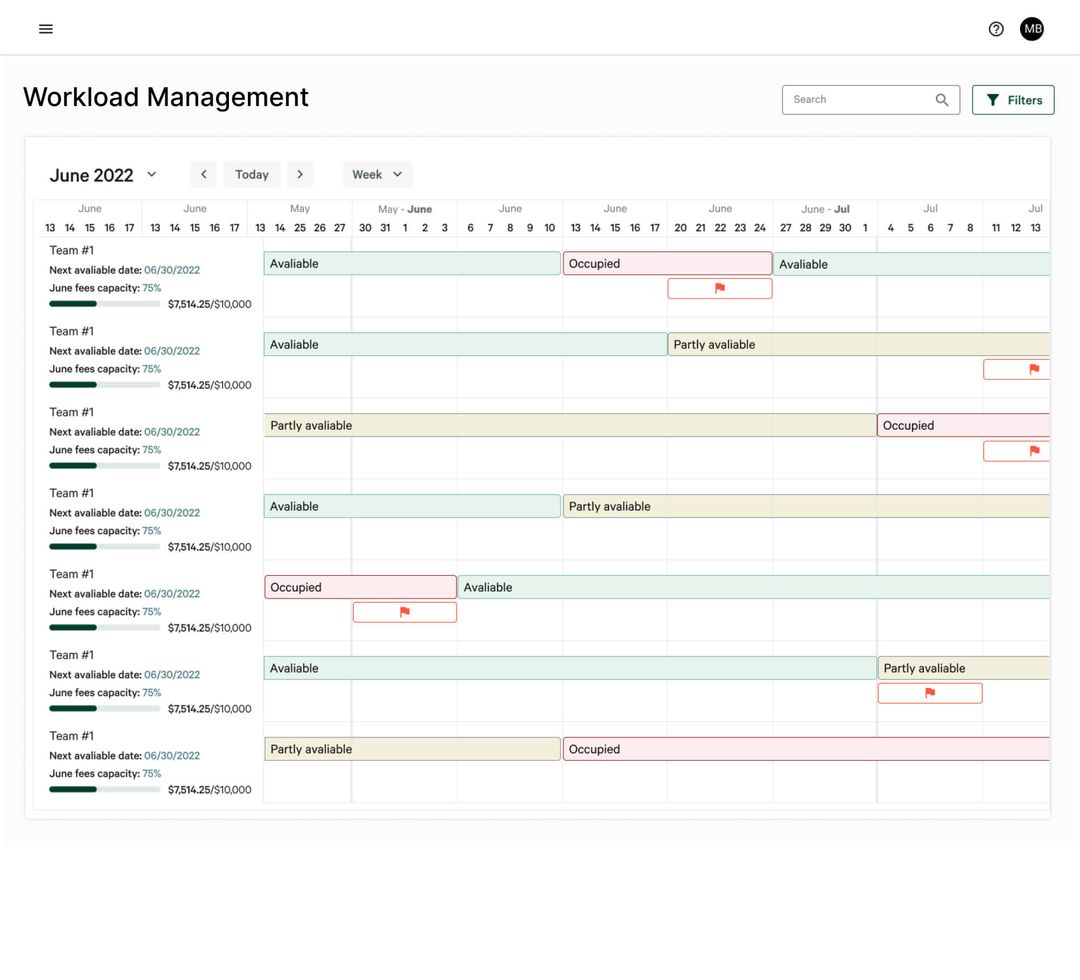


Concept #1: Manager View
Concept #1: Manager View
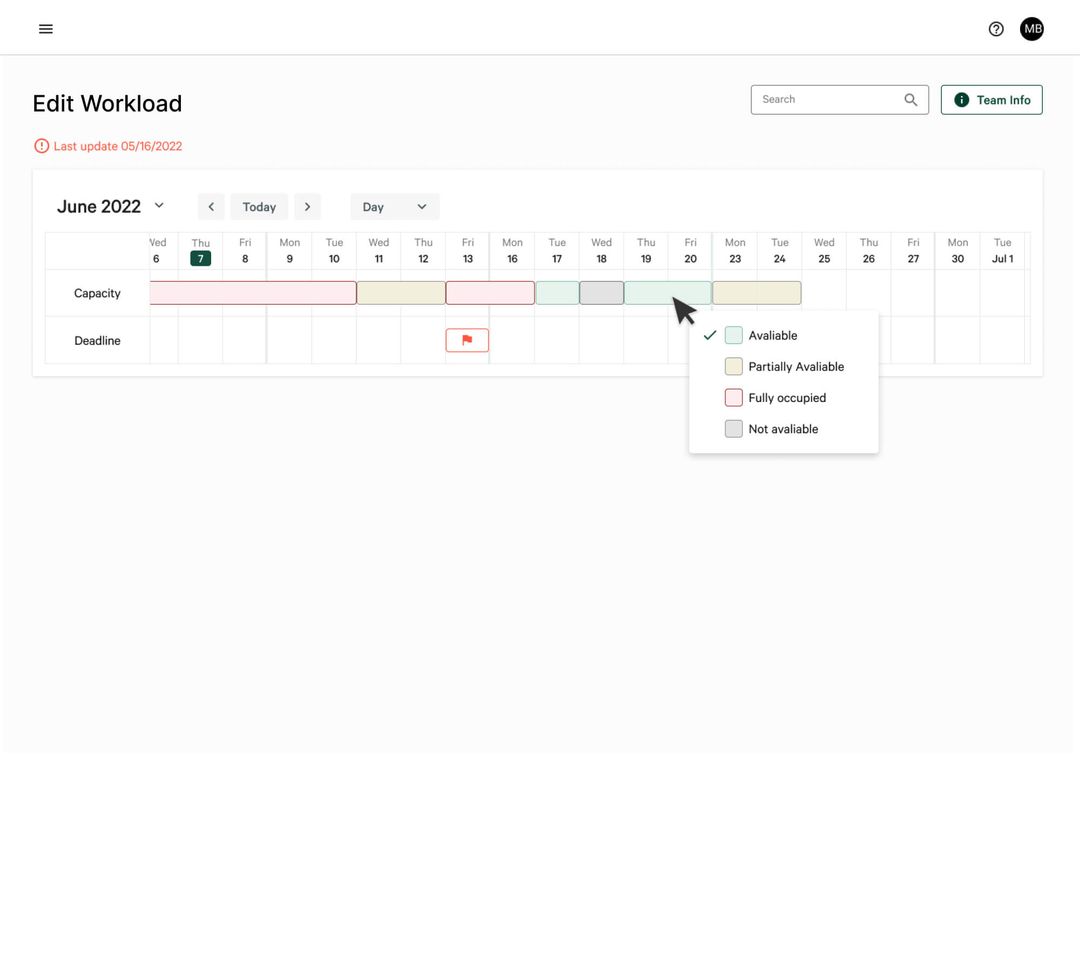


Concept #2: Appraiser View
Concept #2: Appraiser View
03. ITERATE
03. ITERATE
03. ITERATE
Combining concepts for final design
Combining concepts for final design
USER TESTING
User Testings
We presented Concept 1 and 2, and another designer's concept (Concept 3) to 12 managers and 5 team members to get their feedback.
We presented Concept 1 and 2, and another designer's concept (Concept 3) to 12 managers and 5 team members to get their feedback.
FEEDBACK 1
Feedback 1
Users' feedback for concept #1: Calendar view
✅ Separated views
✅ Visual representation of workload level
❌ Compare team workload
❌ Effort on editing workload for a week
Users' feedback for concept #1: Calendar view
✅ Separated views
✅ Visual representation of workload level
❌ Compare team workload
❌ Effort on editing workload for a week


FEEDBACK 2
Feedback 2
Users' feedback for concept #2: Gantt chart view
✅ Separated views
✅ Least effort for team members to edit workload
❌ Layout looks busy
Users' feedback for concept #2: Gantt chart view
✅ Separated views
✅ Least effort for team members to edit workload
❌ Layout looks busy


FEEDBACK 3
Feedback 3
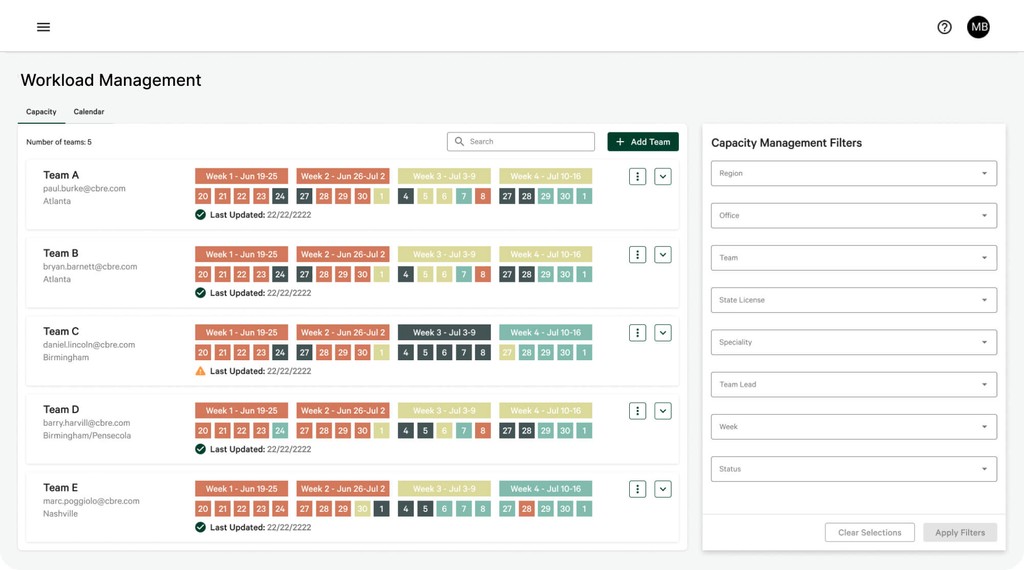
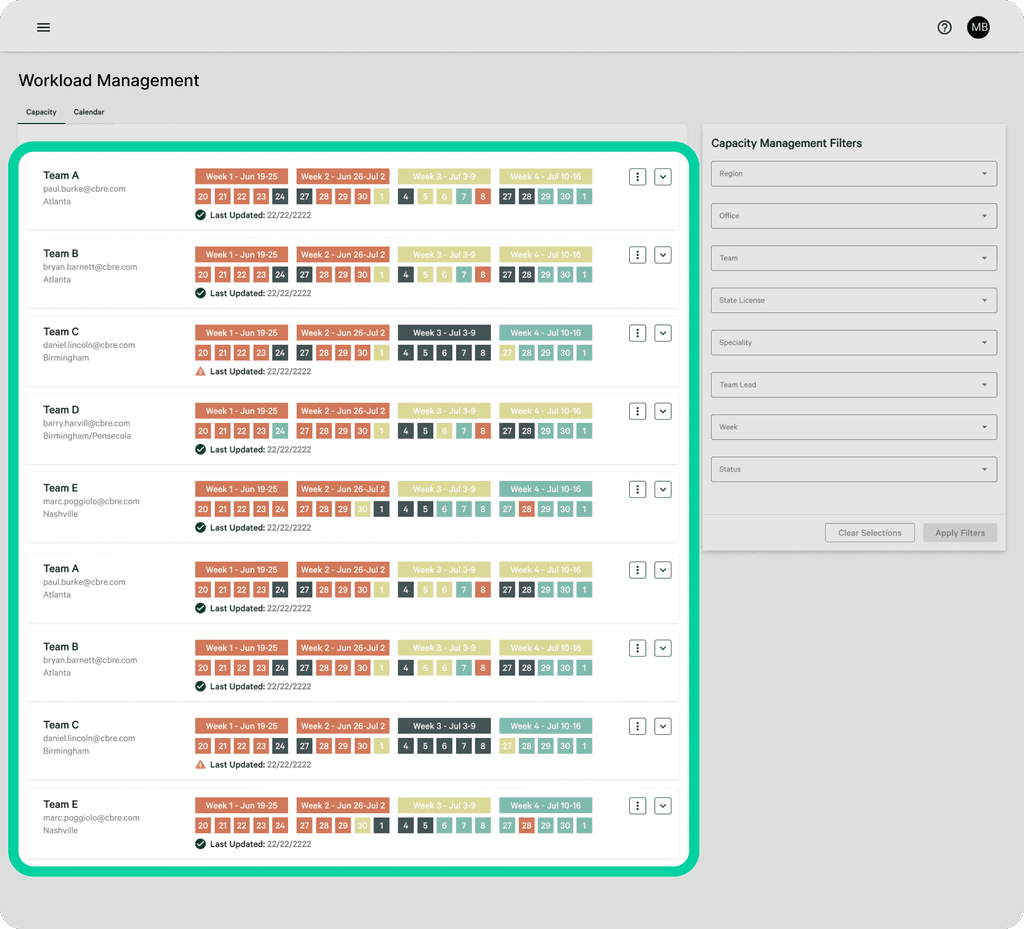
Users' feedback for concept #3
* Concept 3 comes from another designer
✅ Clean Layout
❌ Visual representation of workload levels is not intuitive
Users' feedback for concept #3
* Concept 3 comes from another designer
✅ Clean Layout
❌ Visual representation of workload levels is not intuitive


SUMMARY
Summary
For the final design, we decided to use Concept 1's visual representation of workload level, combined with Concept 2's speed to edit workload, and Concept 3's layout.
For the final design, we decided to use Concept 1's visual representation of workload level, combined with Concept 2's speed to edit workload, and Concept 3's layout.
Final Design = Concept 1 + Concept 2 + Concept 3
Final Design =
Concept 1 + Concept 2 + Concept 3


Concept 1's workload legends
Concept 1's workload legends


Concept 2's speed to edit workload
Concept 2's speed to edit workload


Concept 3's layout
Concept 3's layout
04. FINAL
04. FINAL
Final Design
Final Design
MANAGER VIEW
Manager View
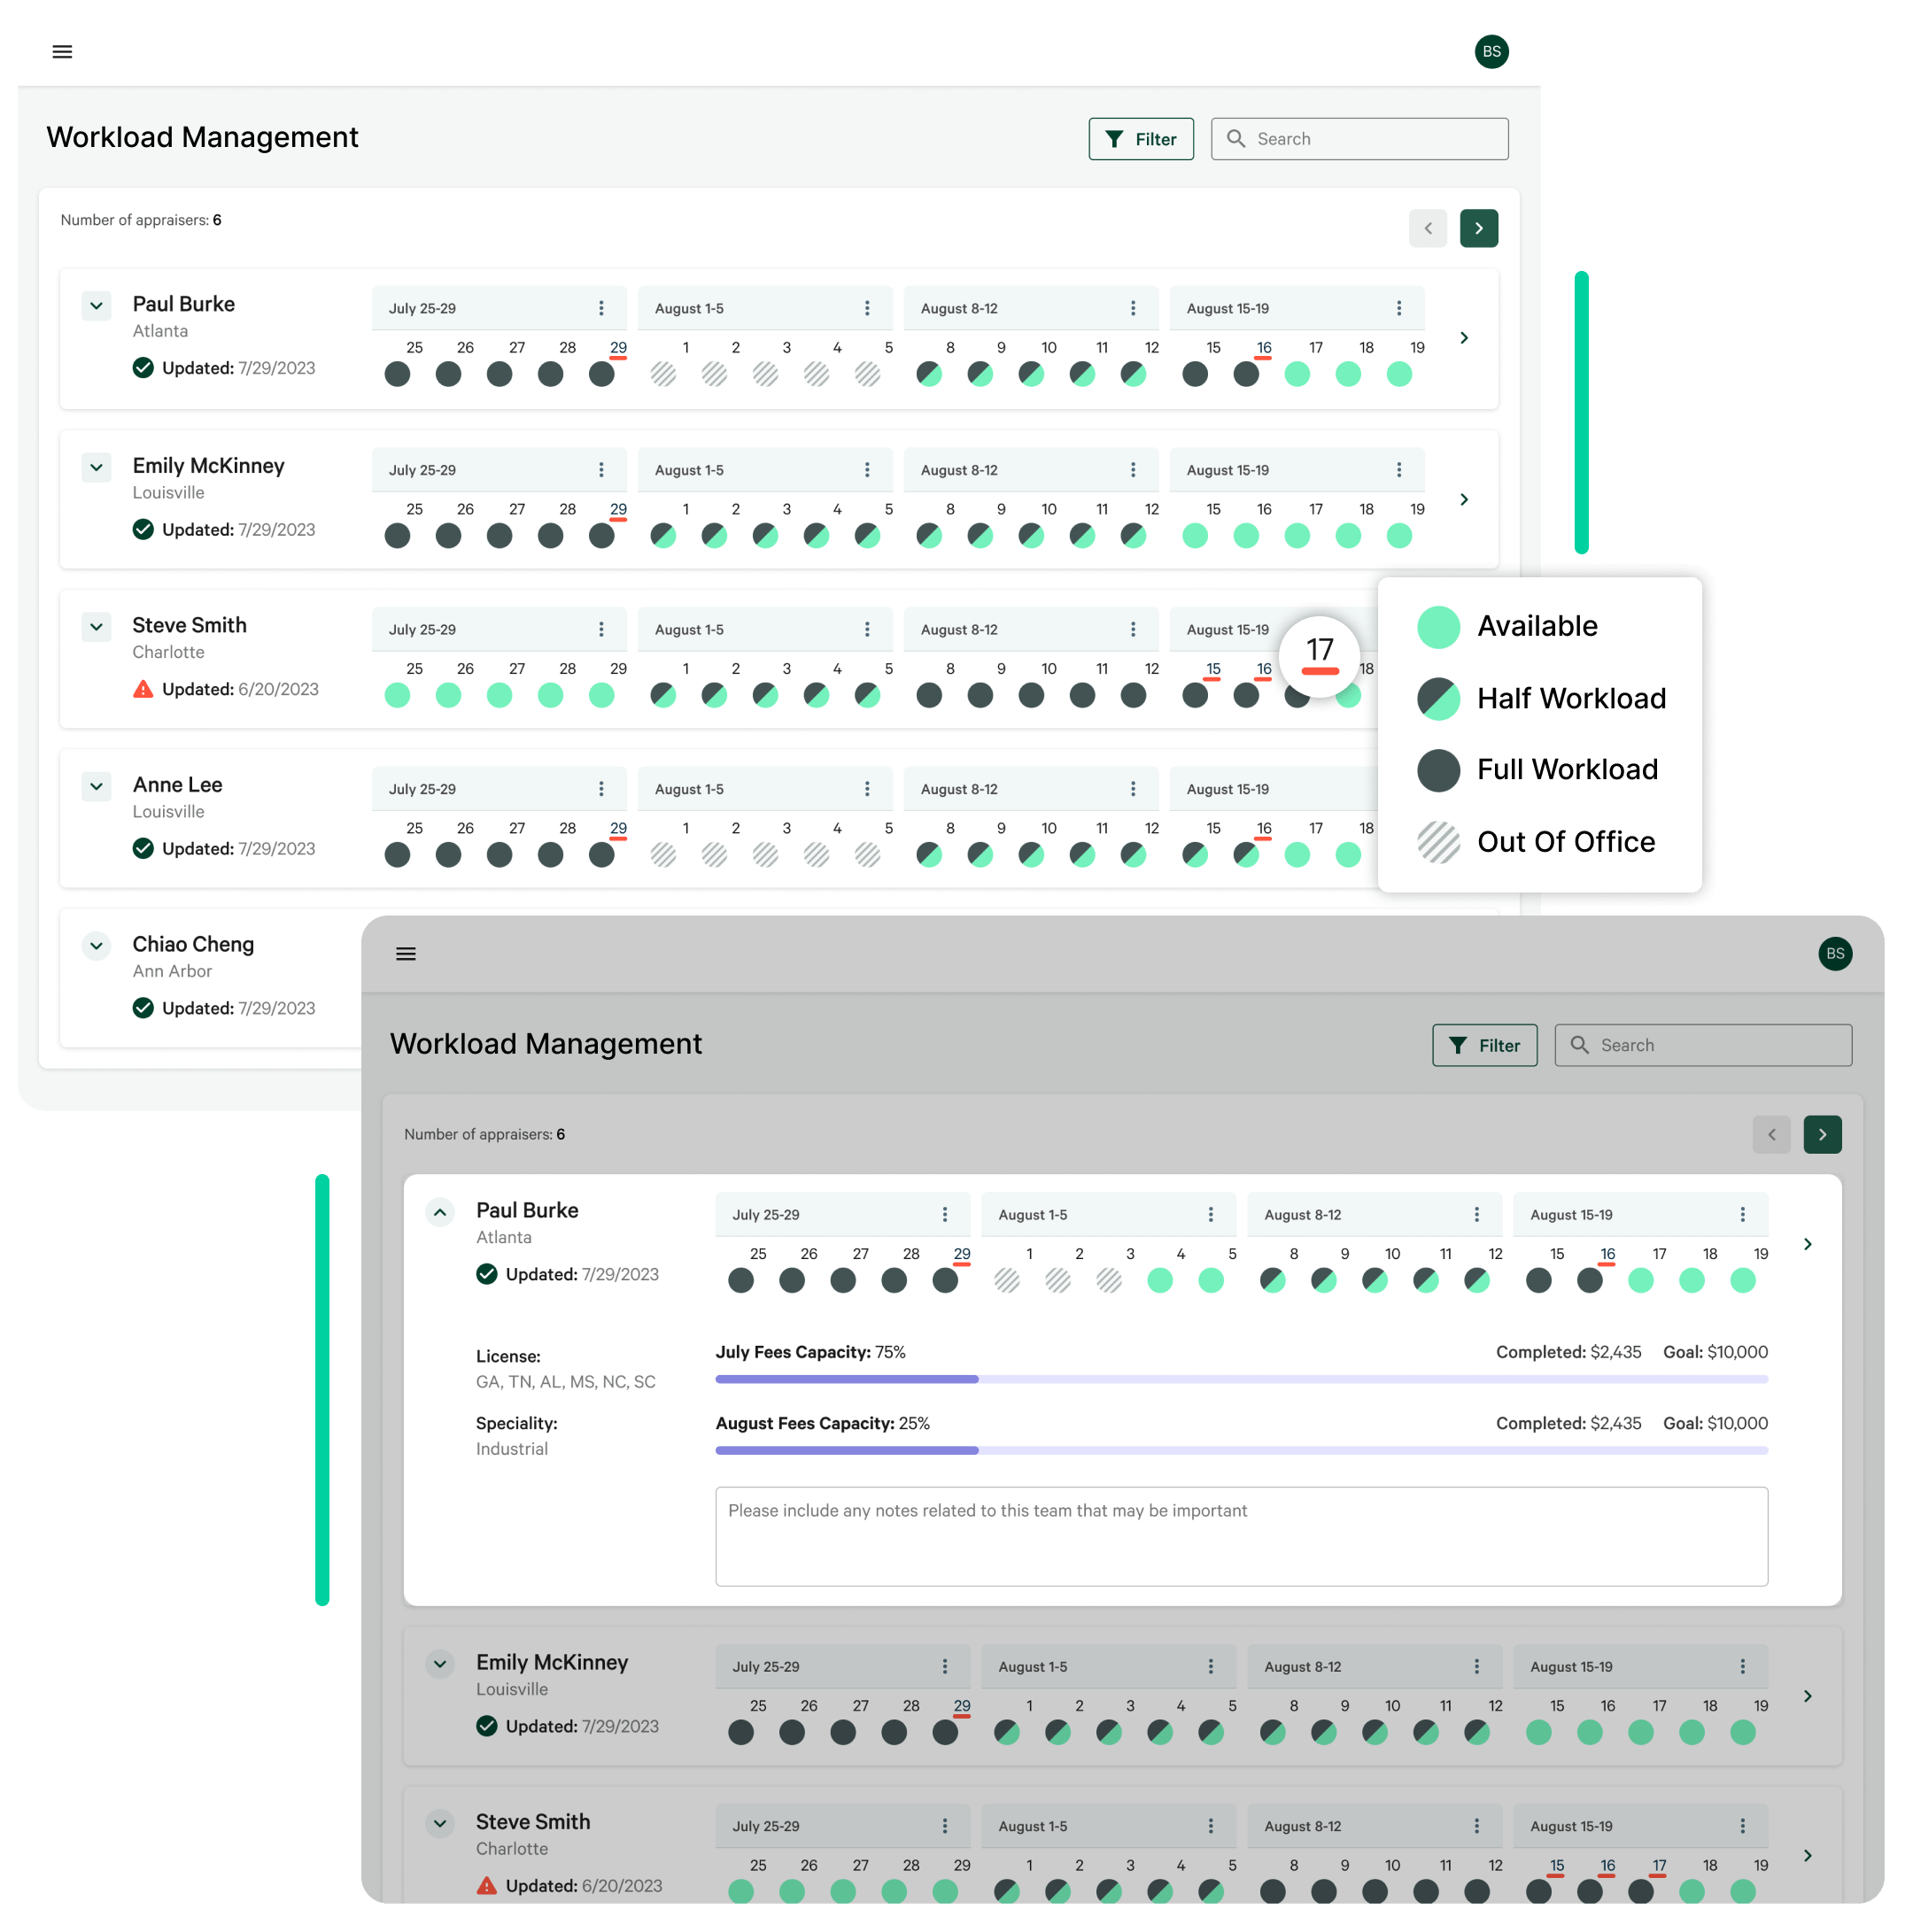
Compare team workloads at a glance:
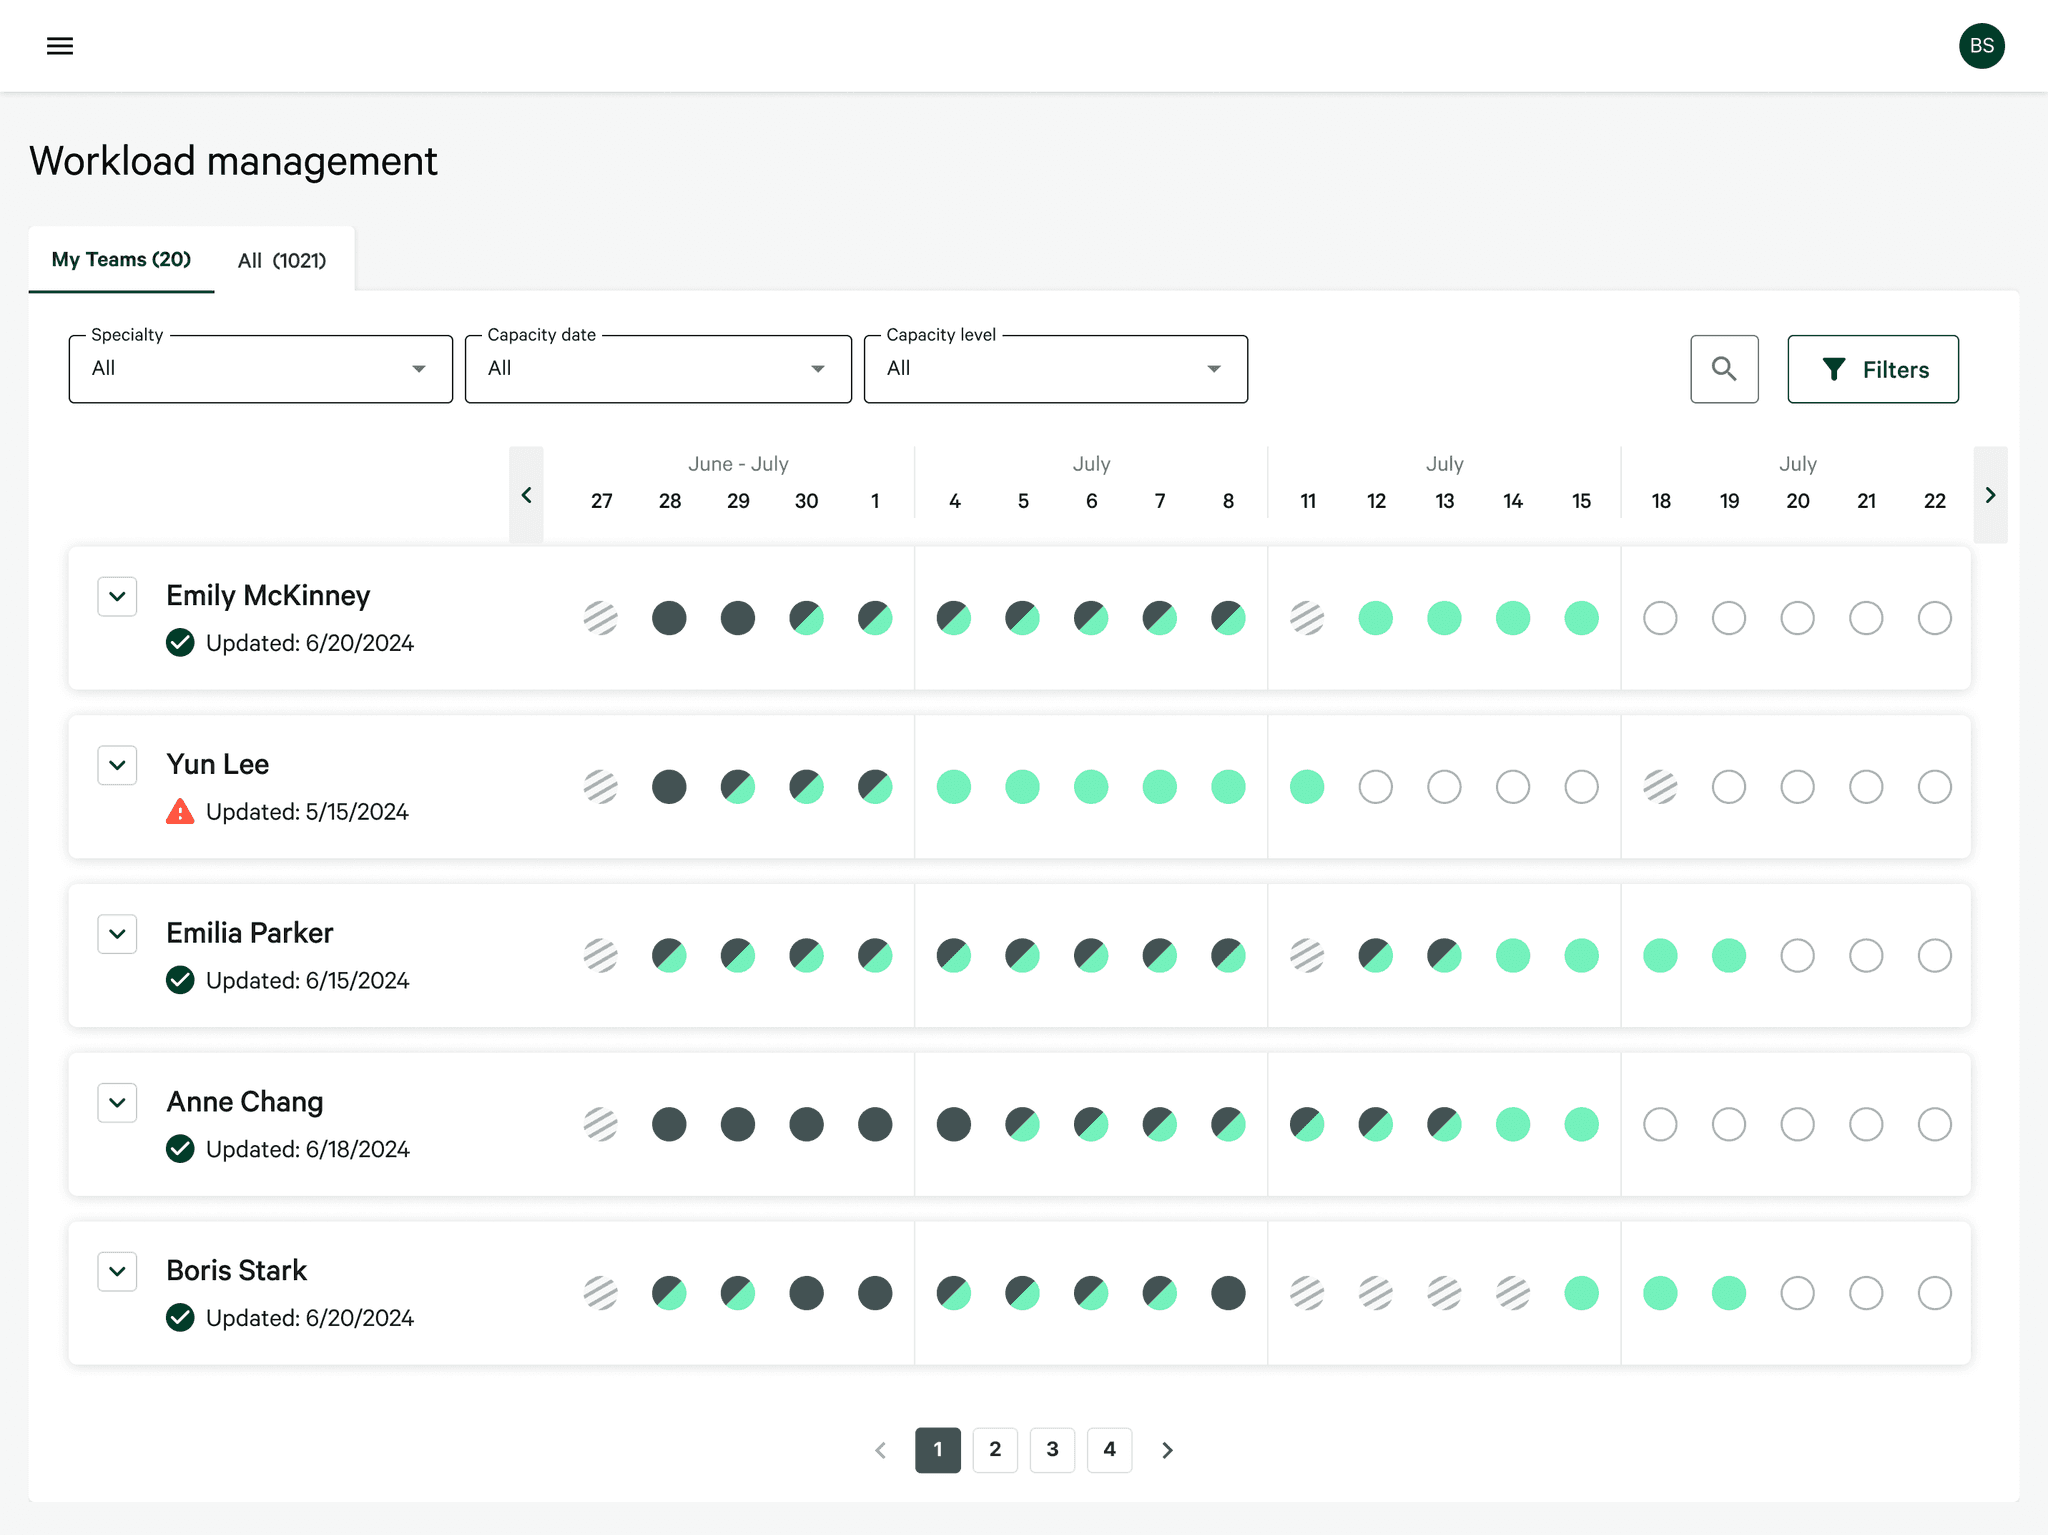
Managers can easily compare teams' schedules in the dashboard. They know each team's goal and when they last updated their workload. Managers can also use filters to filter out the teams that have capacity at that time.
Compare team workloads at a glance:
Managers can easily compare teams' schedules in the dashboard. They know each team's goal and when they last updated their workload. Managers can also use filters to filter out the teams that have capacity at that time.


APPRAISER VIEW
Appraiser View
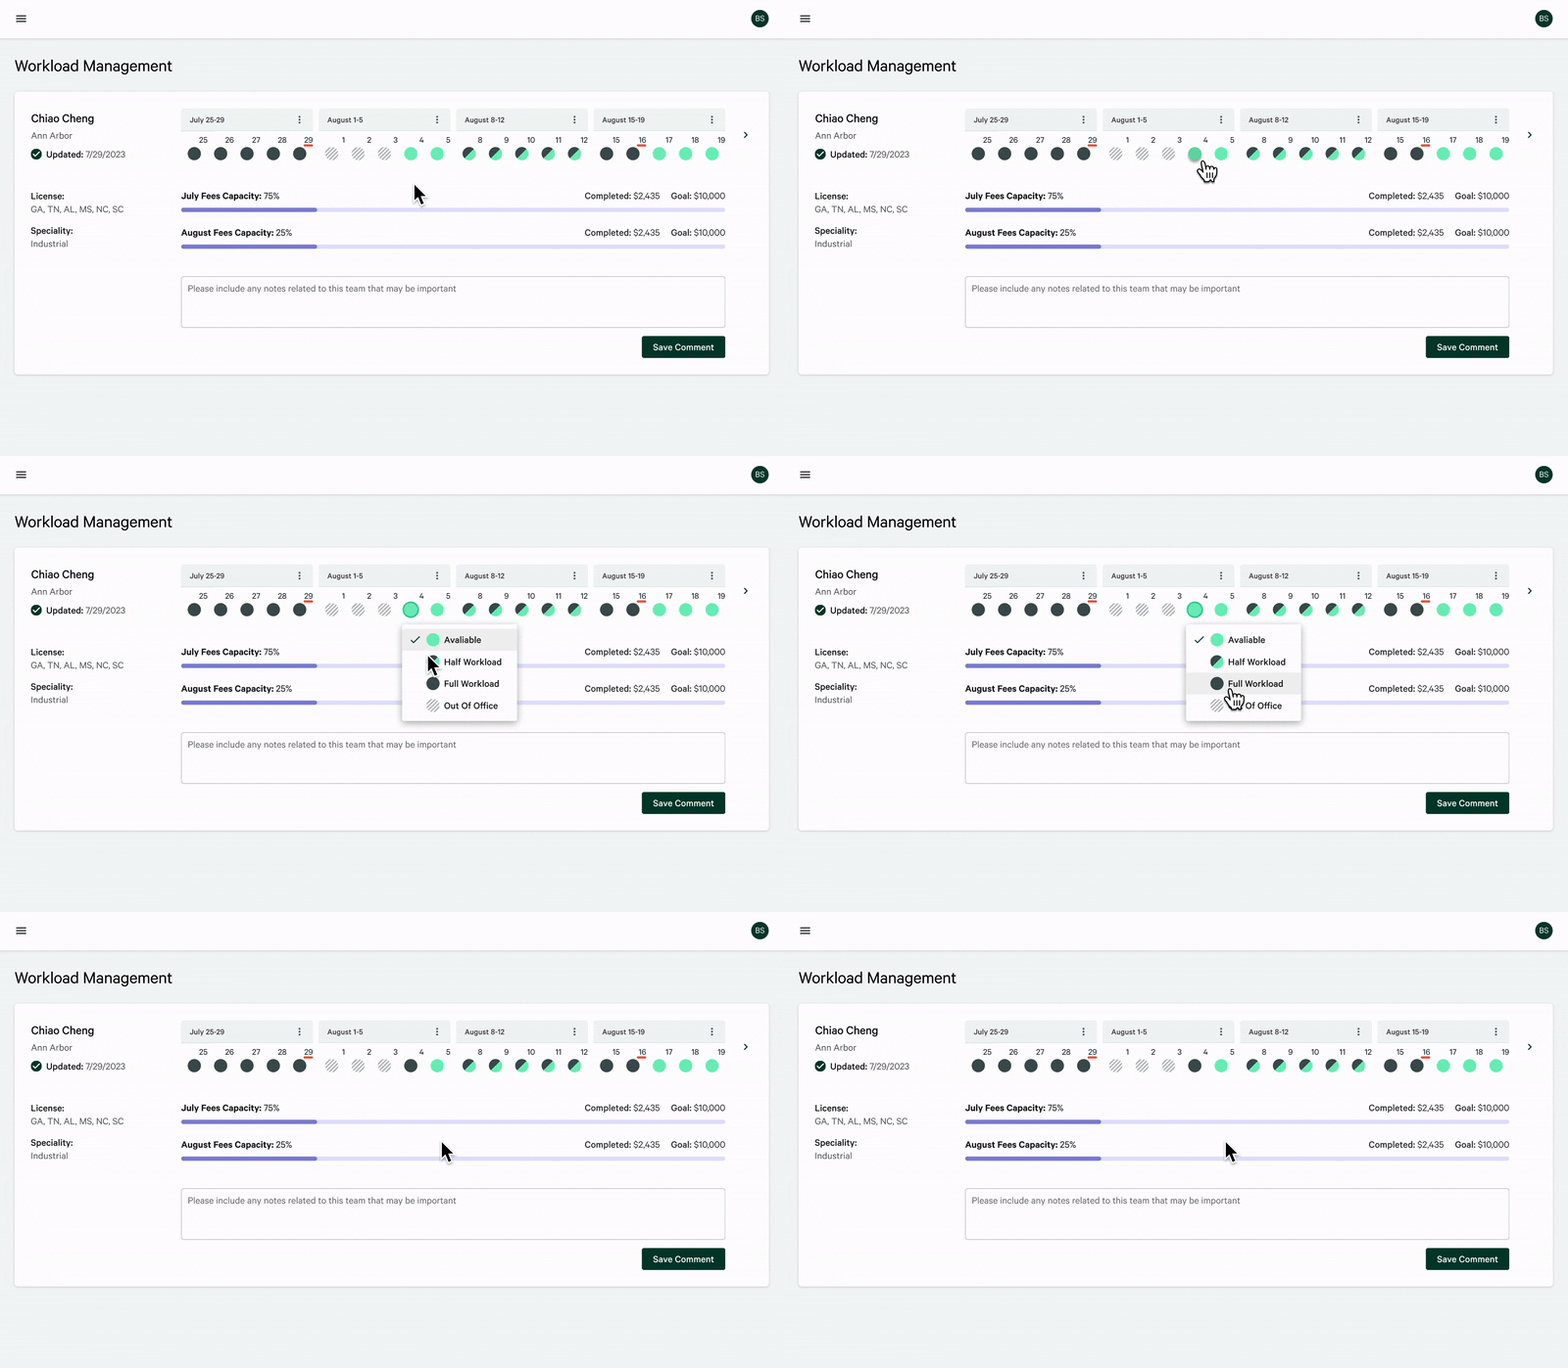
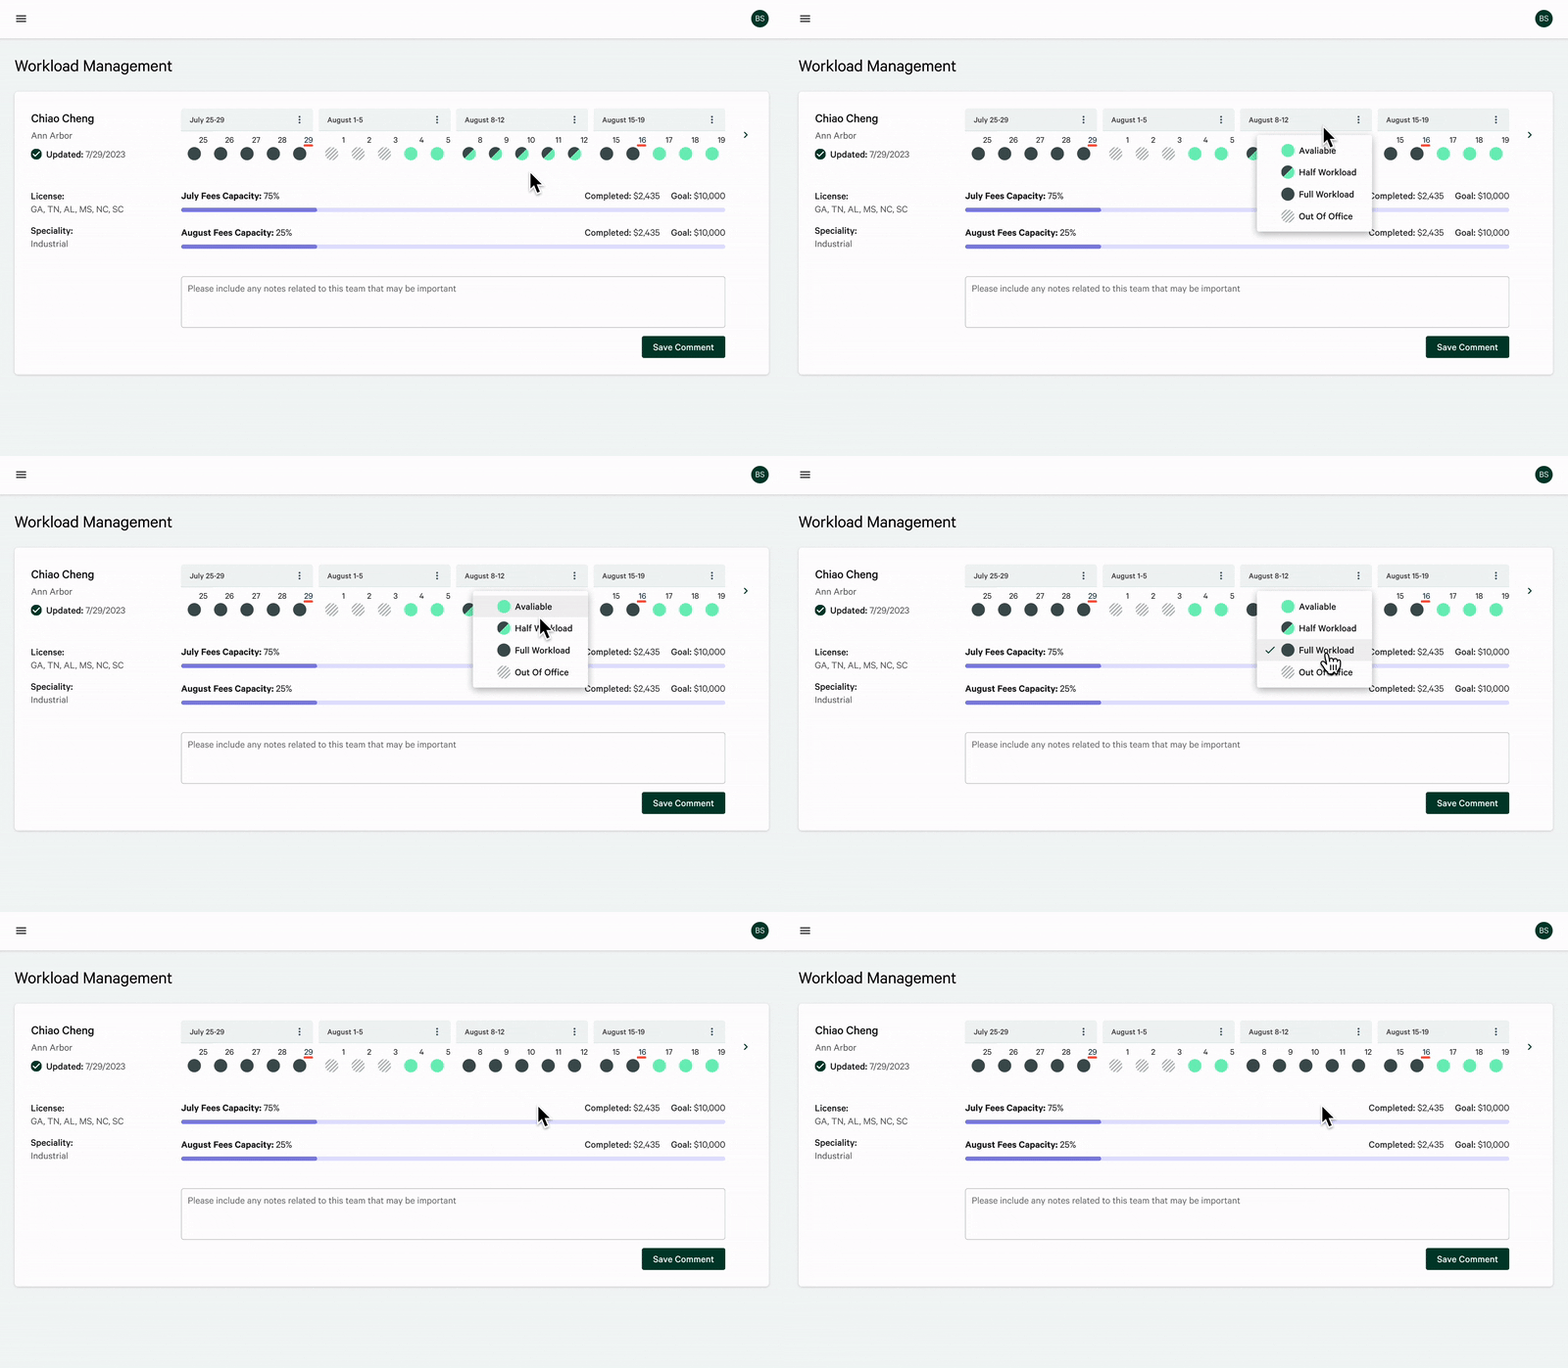
Quick and easy to edit workload:
Appraisers can finish editing their workload for a whole week or just a day in just 2 clicks
Quick and easy to edit workload:
Appraisers can finish editing their workload for a whole week or just a day in just 2 clicks


03.
03.
03.
Reflections
Reflections
DON'T GET ATTACHED
Don't Get Attached
During my internship, I learned that as a designer, it is important to not get too attached to your designs and to seek feedback from those with differing opinions. I learned to actively ask "why" and "how" to have productive conversations that push designs towards solving problems.
During my internship, I learned that as a designer, it is important to not get too attached to your designs and to seek feedback from those with differing opinions. I learned to actively ask "why" and "how" to have productive conversations that push designs towards solving problems.
BE PROACTIVE
Be Proactive
I learned that project managers can sometimes be unsure about the design requirements, and it's the responsibility of the UX team to take the lead by presenting visuals and sharing our initial ideas. I discovered that embracing ambiguity and proactively asking questions was essential to move communication forward.
I learned that project managers can sometimes be unsure about the design requirements, and it's the responsibility of the UX team to take the lead by presenting visuals and sharing our initial ideas. I discovered that embracing ambiguity and proactively asking questions was essential to move communication forward.
STEPPING BACK TO MOVE FORWARD
Stepping Back to Move Forward
I found myself hitting a wall when creating different layout variations. However, a senior designer on my team suggested stepping back from layout ideas and exploring the concepts from the users' perspectives. This experience taught me the importance of taking a step back and examining user needs to generate more ideas.
I found myself hitting a wall when creating different layout variations. However, a senior designer on my team suggested stepping back from layout ideas and exploring the concepts from the users' perspectives. This experience taught me the importance of taking a step back and examining user needs to generate more ideas.






I learned a lot from amazing people during my internship.
The UX team and senior designers provided valuable feedback.
I learned a lot from amazing people during my internship.
The UX team and senior designers provided valuable feedback.
The UX team and senior designers provided valuable feedback.
I learned a lot from amazing people during my internship.